This is a good time to review the Fed’s balance sheet, now that the Federal Reserve Board’s meeting is behind us and the interest rate debate accelerates.
There have been some who have suggested the Fed is not transparent with its open market activity and corresponding financial reports. We find the weekly release along with the more detailed annual report to be robust; both are referenced in the paragraphs below. Both the 2016 year-end report and the weekly balance sheet can be accessed through the Federal Reserve’s website.
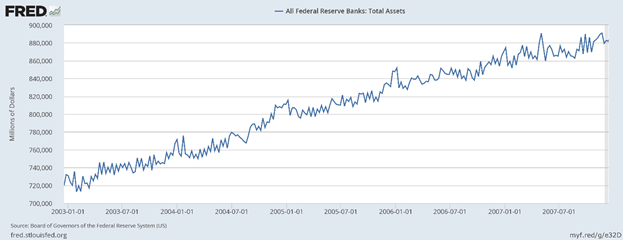
Our concerns are fundamental. With the information and knowledge provided through regularly reported financial statements, we arrive at conclusions that make us lose sleep due to their ambiguous and potentially serious consequences. Let’s start with the point where we believe the issue began, at the end of 2007. At that moment in time, the US financial markets were just beginning to exhibit financial and economic red-flag warnings. Subsequently, major shocks to the financial system prompted monetary and fiscal policymakers to react in the best way they knew. Leaving fiscal policy aside for now, and concentrating on the Feds’ balance sheet , here is a look at the growth of balance sheet assets going into the financial crisis:
Historically, the Fed matches assets with liabilities which include a combination of a) Federal Reserve Notes (currency), b) member bank Required Reserves, and c) de minimis other liabilities. The Fed, like every other business, also has equity capital (albeit a very small amount), which along with its liabilities, sum to equal its assets.
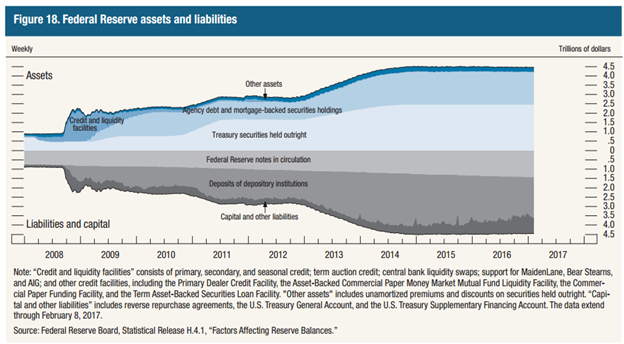
In response to the financial crisis that developed in the late 2000s, the Fed begin implementing a series of asset purchases referred to generally as Quantitative Easing (QE). These QE programs began with limited scope, but quickly evolved from QE1 and QE2 into a broad-based policy of QE until the Fed’s various “price stability and full employment” objectives were achieved. By the time the Fed declared a quasi-end to its QE program, its balance sheet had expanded significantly:
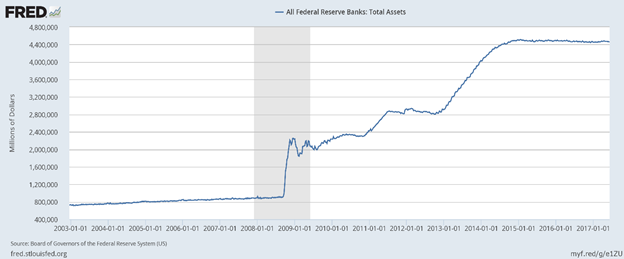
You will observe in the above chart the initial QE program followed by repeated interventions by the Fed. The Fed’s objective was to manage the slope of the yield curve with the expectation that decreasing long-term interest rates and holding them at depressed levels would stimulate demand for loans, expanding credit and boosting economic growth. Further, the Fed often verbalized its concern that the US might enter a period of deflation, which could have serious consequences for our financial system. To say the Fed was successful would be an understatement; both long-term and short-term rates in the US have reached never-before seen levels. In fact, the Fed’s banking counterparts in Europe and Japan, following the Fed’s lead, reduced short-term rates to negative levels – yes, banks paid customers to borrow money!
So at this point, we have a Fed with the policy of managing (aka manipulating) long-term rates to its advantage in order to stimulate economic growth. By easing access to credit and encouraging consumers and businesses to borrow and invest, the Fed sought to reflate a US economy that had bouts of Depression Era economic symptoms for short intervals.
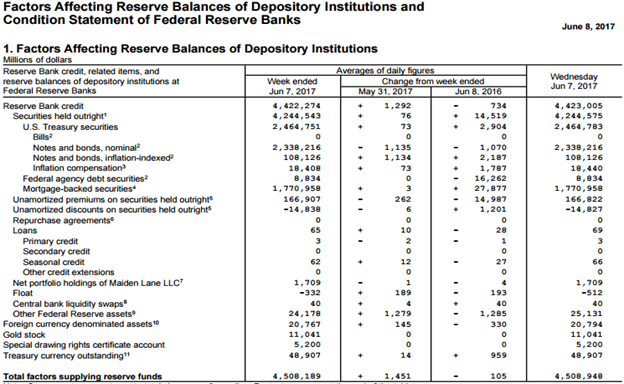
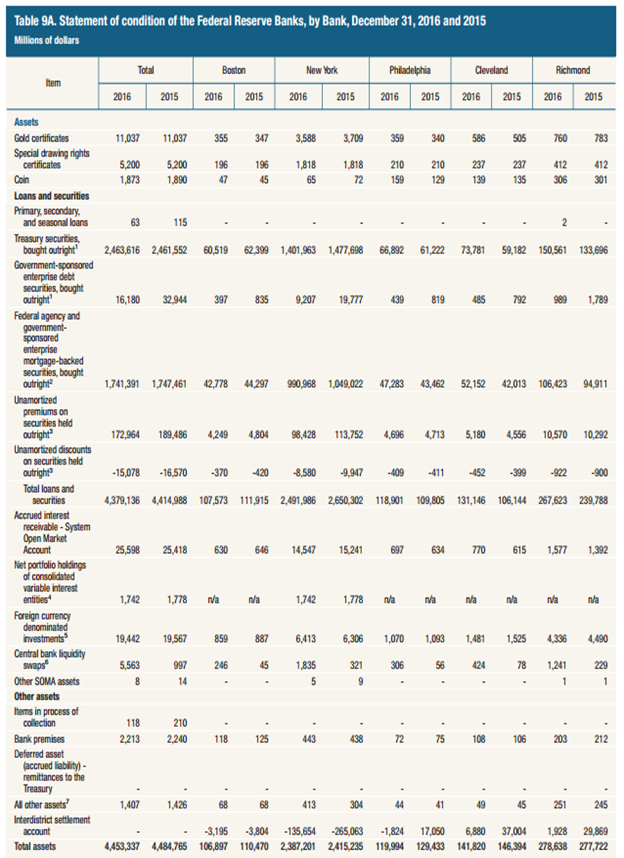
But, the Fed increased its balance sheet by expanding both its assets and liabilities. Again, looking at the Fed’s balance sheet at year-end 2007, the Fed had just over $900 billion in assets, as this long-term table details:
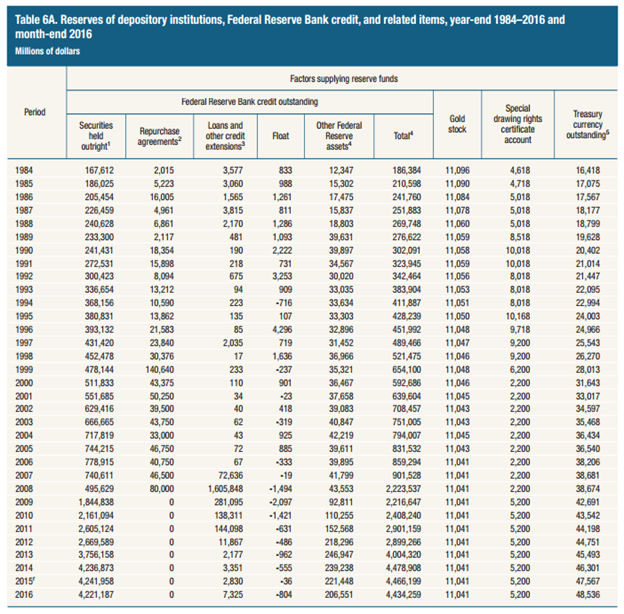
The balance sheet subsequently increased to $4,434 billion by year-end 2016 (that is, $4.4 trillion). The asset increase was principally from the Fed’s purchase of US Treasury debt and mortgage backed securities (aka real estate mortgages).
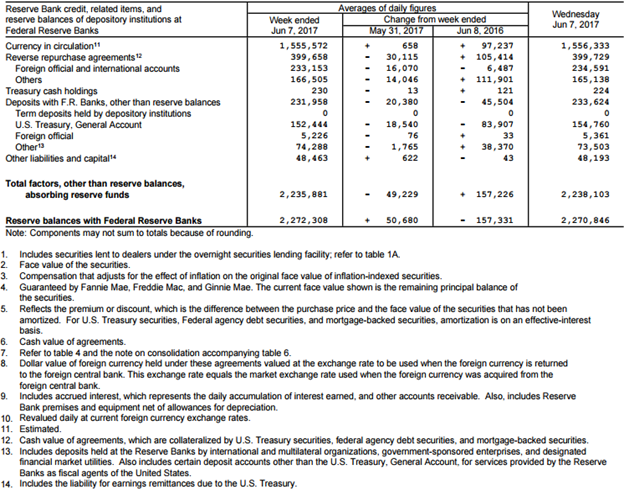
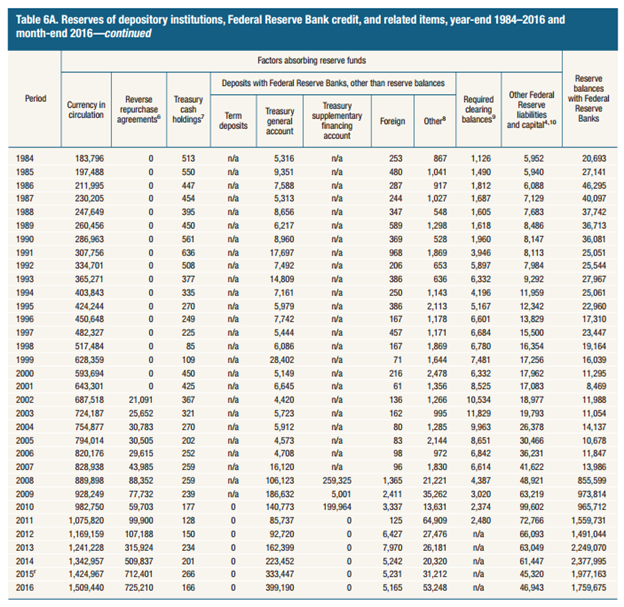
In order to fund these asset purchases (recall we are looking at a balance sheet which is “balancing” assets and liabilities), the Fed also increased the liability side of the balance sheet, which is presented below in this long-term table (the sum of each row represent total liabilities):
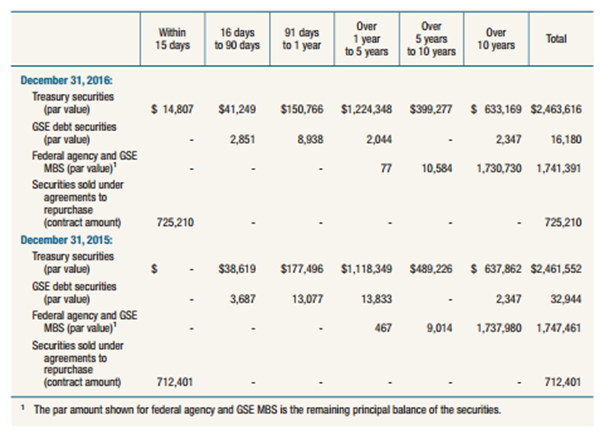
Looking more closely at the Fed’s increased asset holdings, we find the assets possess an unfavorable characteristic for an investor that requires liquidity; that is, the maturity schedule is skewed to long-term debt in a world in which interest rates will most likely rise. Rising interest rates cause fixed income (bonds and debt instruments) asset values to decline. The higher the quality of the asset, the greater its sensitivity to rising interest rates. The Fed holds the highest quality securities with maturities as follows (as of 12/31/16):
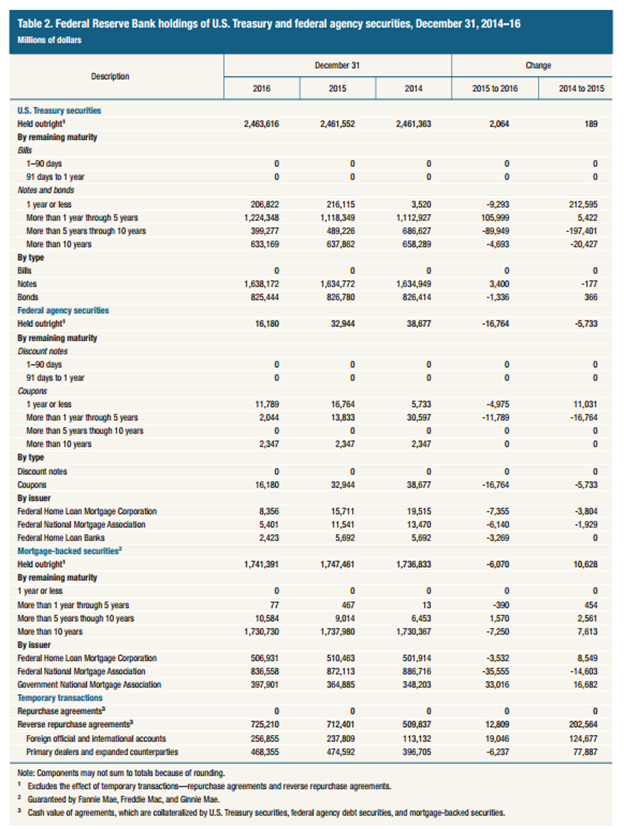
In fact, from 2015 to 2016, the maturity skew (i.e. range) for US Treasuries increased, whereas the mortgage portfolio remained roughly unchanged, with most maturities more than 10 years. Concern with the mortgage portfolio arises when one considers the disincentive for mortgage borrowers to refinance in a rising interest rate environment. This should cause the Fed’s mortgage portfolio to become less dynamic, and as the underlying loans exhibit longer lives, the average expected maturity of the portfolio will increase.
Assets increased from approximately $900 billion to approximately $4,400 billion during the crisis as the Fed bought US Treasuries and mortgaged back securities in an effort to keep interest rates low and stimulate economic growth. Another look at maturities by asset year-over-year:
Before drawing conclusions solely on the basis of the increase in assets, we need to look at the very important funding of these asset purchase – the liabilities the Fed incurred during the same period.
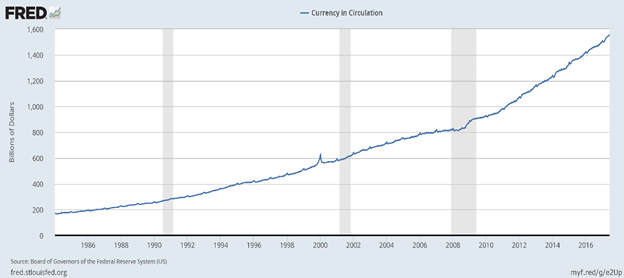
Historically, the Fed has increased its balance sheet by issuing Federal Reserve Notes (currency). The chart below represents the amount of Federal Reserve Notes in circulation over the past several decades (also reference the above table 6A, first column). In addition, each of the Federal Reserve member banks is subject to holding a certain level of Required Reserves expressed as a percent of a bank’s deposits (for the protection of depositors). It is worth noting the smallest banks may be subject to a 0% reserve requirement and the largest banks generally have a 10% reserve requirement.
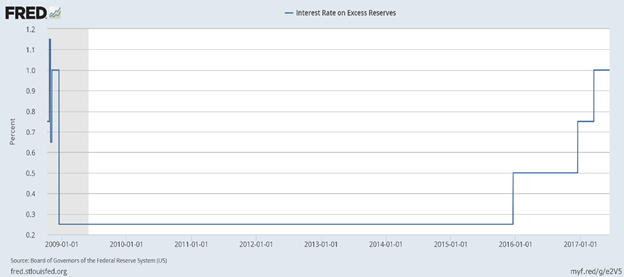
The recent runup in the Fed’s balance sheet liabilities is attributable largely to funds held with the Fed by member banks. Because Required Reserves were woefully inadequate to fund the Fed’s aggressive quantitative easing programs, the Fed began paying interest on the Excess Reserves of member banks, an unprecedented incentive to attract deposits. The chart below, which begins at the inception of the program in 2008, shows the interest rate the Fed paid on Excess Reserves:
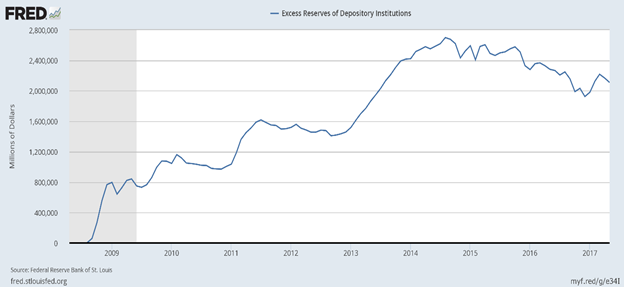
The far more interesting aspect of this incentive is the ballooning of Excess Reserves, which were essentially non-existent prior to 2008, as shown below:
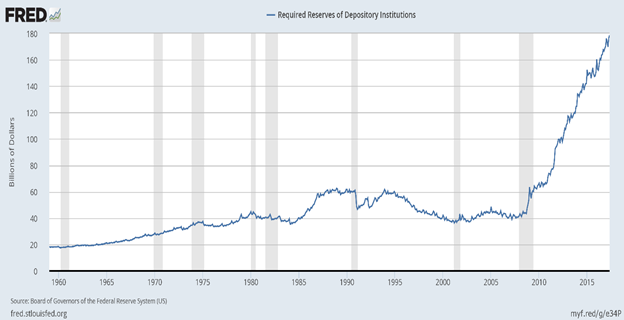
Required Reserves also began to expand around 2009 as risk-averse investors sought the safety of bank deposits, concurrent with an increase in the FDIC Deposit Insurance level from $100,000 to $250,000. While this increase in bank deposits naturally caused a corresponding increase in Required Reserves held with the Fed, the relationship between Required Reserves and Excess Reserves is stunning. Today, the Fed holds about $160 billion in Required Reserves and approximately $2,200 billion in Excess Reserves, a ratio of nearly 14:1.
The totality of the assets and liabilities held by the Fed is illustrated in this chart from the organization’s 103rd annual report:
Conclusions:
The Fed has recently discussed returning to a normalized level of asset ownership. Fed Chair Yellen has suggested the Fed will simply allow maturing securities to roll off and be tendered, as opposed to the long-standing policy of reinvesting principal and interest payments. The ultimate desirable level of asset ownership by the Fed is unknown, but if one were to use the rough historic average growth rate of the Fed’s assets and extrapolate this measurement through approximately 2020, it would be reasonable to assume the Fed would achieve an ‘steady state’ level of assets in the $2.25-$2.50 trillion range. In an otherwise unremarkable economic environment, the Fed could potentially execute an orderly “rolling off” of maturing bonds.
The first and biggest uncertainty in this seemingly simple strategy lies in the inflated level of Excess Reserves, which are essentially overnight funds on deposit. If at any time a member bank has higher return alternatives, i.e. a bona-fide borrower willing to borrow at market rates, the bank can withdraw its Excess Reserves immediately. At that point, if the Fed doesn’t have liquid assets, such as cash, to meet the demand, it would need to sell some of its assets. If there were a sudden increase among member banks to draw down Excess Reserves due to a strengthening economy and/or increased demand for credit – which we all hope and trust will occur at some point – then the Fed could find itself in the awkward position of having to sell its longer-dated bonds. If at that point in time, interest rates have risen, a process that the Fed is orchestrating at this very moment, then with certainty, those longer-dated bonds (US Treasury or mortgage backed) will be worth less (conceivably significantly so) than when they were purchased. The Fed has generally held the value of its balance sheet assets at cost, making no “market-value adjustments” – a practice permitted for corporations per GAAP accounting rules if the assumption is that the asset is held to maturity.
Thus far, we have looked only at asset and liabilities but made no mention of balance sheet equity capital (net worth). The following is the Feds’ full balance sheet, with equity capital included as of year-end 2016:
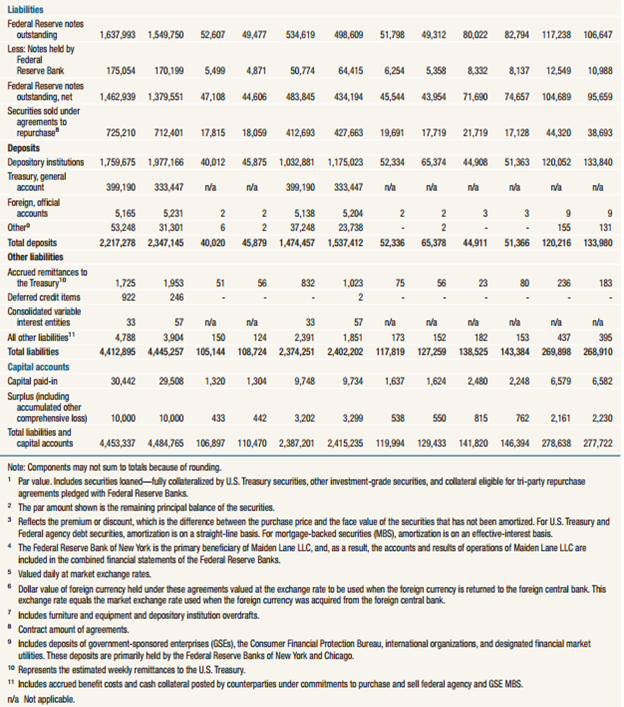
The Fed has a mere $40 billion in equity capital (paid-in capital and surplus). A modest loss on bonds sold from a $4.5 trillion portfolio could easily wipe out 100% of the Feds’ equity. Does this matter? Could the Fed operate with negative equity? These are unknowns. However, as with all things economic, astute investors need to contemplate both the known and unknown in order to prepare for future opportunity (or disaster as the case may be).
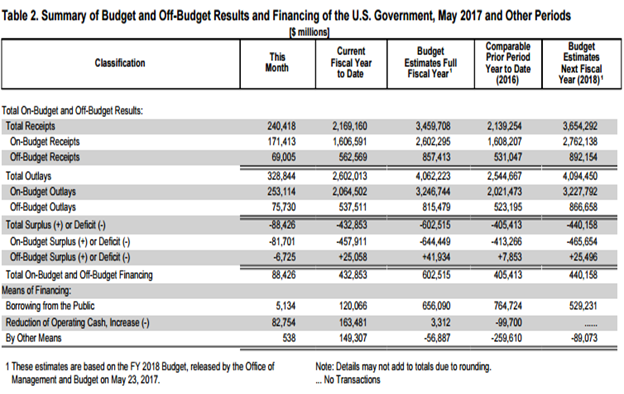
Our second concern relates to the normal “rolling-off” of debt. For the past eight years the Fed has been a regular and larger buyer of US Treasury debt. The total US Government debt today stands at about $20 trillion, a truly daunting number. The Office of Management and Budget projects a budget deficit of roughly $603 billion in 2017 and roughly $440 billion in 2018. Details below show the 2016 federal budget deficit, as well as estimates for 2017 and 2018.
When the Fed begins to roll off its holdings of Treasuries, they will no longer be participating in US Treasury debt auctions or financing additional newly issued federal debt. Assume that the United States issues an additional $1 trillion in debt from ongoing budget losses through 2018, plus some additional amount of debt to refinance maturing Treasury obligations. Chair Yellen recently provided guidance on the timing and magnitude of the divestiture of the Fed’s assets, and the market will need to be ready to absorb hundreds of billions of dollars of its maturing securities. This will need to be financed through buyers other than the Fed.

Over the past decades, the Japanese have been regular buyers of US Treasury debt. In more recent years, the Chinese have also had material participation. In fact, both countries hold over $1 trillion of Treasury debt. The table below shows the current foreign holders of Treasury securities:
Both Japan and China have been reducing their holdings over the past year. The unknown, then, is who will show up at the auction to buy US Treasury debt? The Fed? Not anymore. Japan, China, or another foreign country? Unknown. US citizens? Given savings rates and the record levels of personal debt, unlikely. Of course, the government will find buyers, but at what price (interest rate)? US capital markets are effective in seeking price discovery, raising rate rates until someone offers to buy and continuing to do so until all debt is sold. The drawback to this situation is self-evident: rising interest rates are not just bad for existing bond holders (reducing the market value of debt securities), they also tend to reduce economic activity by creating a disincentive to borrow and invest. So the solution could become the problem once again!
Alternatively, if the Fed prefers not to sell bonds or liquidate assets to meet withdrawal demands, it could simply replace one liability with another – increase the amount of Federal Reserve Notes – that is, print more money. This is an option, but one that should make every investor nervous with memories of prior periods of hyper-inflation caused by central bank money printing.
In conclusion, the Fed is in an awkward position. To be sure, they created this mess. However, the fix is far more complicated than the “rolling-off” of maturities as some project. In our opinion, there is no simple solution. To hope and pray things work out is a grossly inadequate strategy. We prefer to continue probing issues related to this situation and seeking opportunistic ways to be positioned in order to avoid financial harm. We welcome your perspective.